
Page 2 - SWGas Annual Report 2015
P. 2
NYSE: SWX
COMPANY PROFILE
Southwest Gas Corporation (“Southwest Gas” or “Company”), headquartered in Las Vegas, NV, provides natural
gas service to over 1.9 million customers in Arizona, Nevada, and California. Centuri Construction Group, Inc.
(“Centuri”), a subsidiary, is a full-service underground piping contractor that primarily provides utility companies
with trenching and installation, replacement, and maintenance services for energy distribution systems, and
develops industrial construction solutions. Centuri operates in 20 major markets in the United States (primarily
under the NPL Construction Co. [“NPL”] name) and in two major markets in Canada (under the Link-Line Contrac-
tors Ltd. and W.S. Nicholls Construction Inc. names).
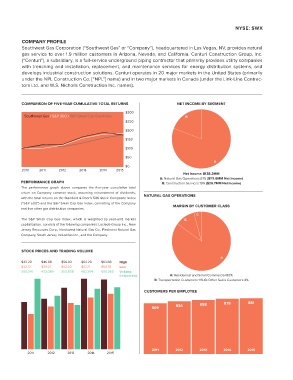
COMPARISON OF FIVE-YEAR CUMULATIVE TOTAL RETURNS NET INCOME BY SEGMENT
B
Southwest Gas / S&P 500 / S&P Small Cap Gas Index $300
$250 A
Net Income: $138.3MM
$200 A: Natural Gas Operations 81% ($111.6MM Net Income)
B: Construction Services 19% ($26.7MM Net Income)
$150 NATURAL GAS OPERATIONS
MARGIN BY CUSTOMER CLASS
$100
C
$50 B
2010 2011 2012 2013 2014 $0
2015
PERFORMANCE GRAPH
The performance graph above compares the five-year cumulative total
return on Company common stock, assuming reinvestment of dividends,
with the total returns on the Standard & Poor's 500 Stock Composite Index
(“S&P 500”) and the S&P Small Cap Gas Index, consisting of the Company
and five other gas distribution companies.
The S&P Small Cap Gas Index, which is weighted by year-end market
capitalization, consists of the following companies: Laclede Group Inc., New
Jersey Resources Corp., Northwest Natural Gas Co., Piedmont Natural Gas
Company, South Jersey Industries Inc., and the Company.
STOCK PRICES AND TRADING VOLUME
$43.20 $46.08 $56.03 $64.20 $63.68 High A
$32.12 $39.01 $42.02 $47.21 $50.78 Low
569,341 432,089 355,808 487,354 500,363 Volume A: Residential and Small Commercial 85%
(in hundreds) B: Transportation Customers 11% C: Other Sales Customers 4%
CUSTOMERS PER EMPLOYEE
809 836 858 879 881
2011 2012 2013 2014 2015
2011 2012 2013 2014 2015