
Page 11 - SWGas Annual Report 2015
P. 11
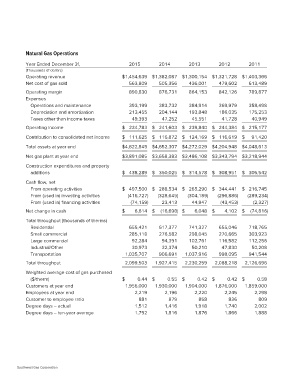
Natural Gas Operations                   2015           2014           2013           2012           2011

Year Ended December 31,                  $1,454,639 $1,382,087 $1,300,154 $1,321,728 $1,403,366
                                             563,809 505,356 436,001 479,602 613,489
(Thousands of dollars)
                                             890,830 876,731 864,153 842,126 789,877
Operating revenue
Net cost of gas sold                     393,199        383,732        384,914        369,979        358,498
                                         213,455        204,144        193,848        186,035        175,253
Operating margin
Expenses                                  49,393         47,252         45,551         41,728         40,949

   Operations and maintenance            $ 234,783 $ 241,603 $ 239,840 $ 244,384 $ 215,177
   Depreciation and amortization
   Taxes other than income taxes         $ 111,625 $ 116,872 $ 124,169 $ 116,619 $ 91,420

Operating income                         $4,822,845 $4,652,307 $4,272,029 $4,204,948 $4,048,613

Contribution to consolidated net income  $3,891,085 $3,658,383 $3,486,108 $3,343,794 $3,218,944

Total assets at year end                 $ 438,289 $ 350,025 $ 314,578 $ 308,951 $ 305,542

Net gas plant at year end                $ 497,500 $ 288,534 $ 265,290 $ 344,441 $ 216,745

Construction expenditures and property   (416,727) (328,645) (304,189) (296,886) (289,234)
   additions
                                         (74,159)       23,413         44,947         (43,453)       (2,327)
Cash flow, net
   From operating activities             $ 6,614 $ (16,698) $ 6,048 $ 4,102 $ (74,816)
   From (used in) investing activities
   From (used in) financing activities     655,421        617,377        741,327        655,046        718,765
                                           285,118        276,582        298,045        270,665        303,923
Net change in cash                                                       102,761        116,582        112,256
                                             92,284         94,391
Total throughput (thousands of therms)       30,973         32,374         50,210         47,830         50,208
   Residential                           1,035,707        906,691      1,037,916        998,095        941,544
   Small commercial
   Large commercial                      2,099,503      1,927,415      2,230,259      2,088,218      2,126,696
   Industrial/Other
   Transportation                        $ 0.44         $ 0.55         $ 0.42         $ 0.42         $ 0.58
                                          1,956,000      1,930,000      1,904,000      1,876,000      1,859,000
Total throughput                                2,219          2,196          2,220          2,245          2,298
                                                   881            879            858            836            809
Weighted average cost of gas purchased          1,512          1,416          1,918          1,740          2,002
   ($/therm)                                    1,792          1,816          1,876          1,866          1,888

Customers at year end
Employees at year end
Customer to employee ratio
Degree days – actual
Degree days – ten-year average

Southwest Gas Corporation