
Page 13 - SWGas Annual Report 2015
P. 13
first quarter of the year due to less favorable winter weather conditions. Revenues typically improve as more
favorable weather conditions occur during the summer and fall months. This is expected in both the U.S. and
Canadian markets. In certain circumstances, such as with large bid contracts (especially those of a longer duration),
or unit-price contracts with revenue caps, results may be impacted by differences between costs incurred and
those anticipated when the work was originally bid.
Executive Summary
The items discussed in this Executive Summary are intended to provide an overview of the results of the Company’s operations
and are covered in greater detail in later sections of management’s discussion and analysis. As reflected in the table below,
the natural gas operations segment accounted for an average of 83% of consolidated net income over the past
three years. As such, management’s discussion and analysis is primarily focused on that segment.
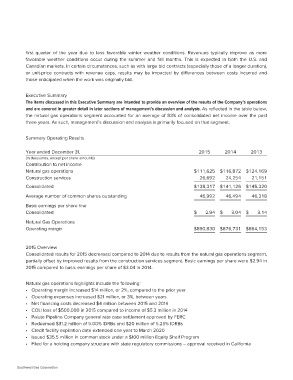
Summary Operating Results 2015 2014 2013
Year ended December 31, $111,625 $116,872 $124,169
26,692 24,254 21,151
(In thousands, except per share amounts)
$138,317 $141,126 $145,320
Contribution to net income 46,992 46,494 46,318
Natural gas operations
Construction services $ 2.94 $ 3.04 $ 3.14
Consolidated
$890,830 $876,731 $864,153
Average number of common shares outstanding
Basic earnings per share fine
Consolidated
Natural Gas Operations
Operating margin
2015 Overview
Consolidated results for 2015 decreased compared to 2014 due to results from the natural gas operations segment,
partially offset by improved results from the construction services segment. Basic earnings per share were $2.94 in
2015 compared to basic earnings per share of $3.04 in 2014.
Natural gas operations highlights include the following:
• Operating margin increased $14 million, or 2%, compared to the prior year
• Operating expenses increased $21 million, or 3%, between years
• Net financing costs decreased $4 million between 2015 and 2014
• COLI loss of $500,000 in 2015 compared to income of $5.3 million in 2014
• Paiute Pipeline Company general rate case settlement approved by FERC
• Redeemed $31.2 million of 5.00% IDRBs and $20 million of 5.25% IDRBs
• Credit facility expiration date extended one year to March 2020
• Issued $35.5 million in common stock under a $100 million Equity Shelf Program
• Filed for a holding company structure with state regulatory commissions – approval received in California
Southwest Gas Corporation